Short answer: there is no single PA school acceptance rate that tells you your odds. Nationally, PAEA reported 34,625 applicants and 12,636 matriculants in the 2024–2025 CASPA cycle. That works out to roughly 36 matriculants per 100 applicants—but it is a national placement ratio, not the acceptance rate at a particular program and not your personal probability of admission.
Program-level numbers are harder. Some schools publish applications, interviews, offers, or class size; many publish only one or two of those figures. Those are different denominators, and combining them carelessly creates a convincing-looking number that may be wrong.
What is the national PA school acceptance rate?
PAEA’s public summary of the 2024–2025 cycle reports 34,625 applicants and 12,636 matriculants. Dividing matriculants by applicants gives about 36.5%. It is reasonable to call that a national applicant-to-matriculant ratio. I would not call it your “chance of getting into PA school.”
Applicants submit to multiple programs, each program makes more offers than the number of seats it ultimately fills, and reapplicants are included in the cycle. Your result also depends on where you apply and whether you meet each school’s actual screens. Read the source in PAEA’s 2024–2025 applicant trend report.
How do you calculate a PA program’s acceptance rate?
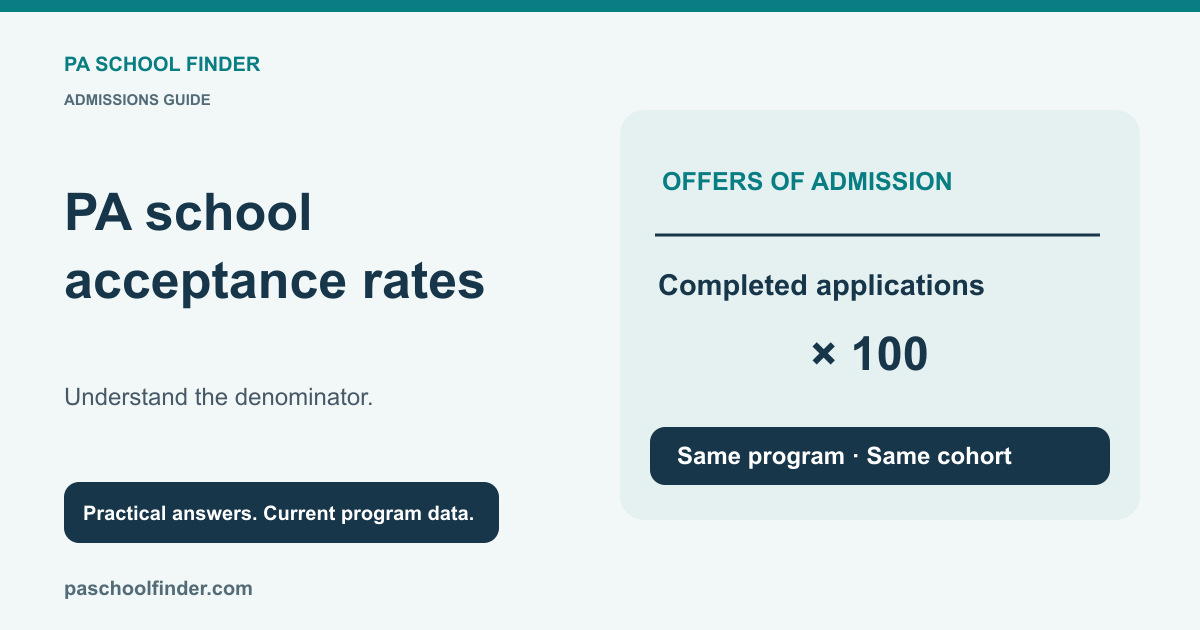
If a program reports both completed applications and admission offers for the same entering class, the simplest calculation is:
offers of admission ÷ completed applications × 100
But many pages substitute class size for offers. That produces a seat-to-application ratio, not an acceptance rate. A program enrolling 40 students may have made 55, 70, or more offers because some accepted applicants choose another school.
- Applications: may mean started, submitted, received, complete, or verified applications.
- Interviews: show how selective the interview stage is, not how many applicants were ultimately admitted.
- Offers: are the correct numerator for a program acceptance rate, but schools do not always publish them.
- Matriculants or class size: show how many students enrolled, not how many were accepted.
Before trusting any percentage, make sure the numerator, denominator, campus, and entering year match.
What matters more than an acceptance-rate list?
Eligibility comes first. A low published rate does not matter if the program’s mission and requirements fit you well; a high-looking rate does not help if you miss a hard GPA, prerequisite, patient-care, residency, or test rule.
I would compare these five things before I compared percentages:
- Hard screens: Do you meet every minimum GPA, prerequisite grade, course-expiration, test, and experience rule?
- Accepted-student profile: How does your GPA and experience compare with the students the program actually enrolled?
- Mission fit: Does your background support the program’s priorities, such as rural care, primary care, service, or regional ties?
- Cost and geography: Can you complete the program without an unsustainable financial or family burden?
- Outcomes and accreditation: What do current PANCE results, attrition, and ARC-PA history show?
Does a larger class mean a PA school is easier to enter?
Not by itself. A larger program has more seats, but it may also attract many more applicants. A small program may receive fewer applications and give strong preference to a specific region or mission. Class size is useful context, not a shortcut to admission odds.
The live list below focuses on programs reporting entering classes under 50 students. It does not report applications or offers of admission.
How can you improve your odds of getting into PA school?
Start by removing schools where you are ineligible. Then build a balanced list around your whole profile instead of chasing one easy-sounding number. Compare your verified CASPA GPA, patient-care experience, prerequisites, location, and mission fit with each program.
Use our guides to PA school GPA requirements, PCE versus HCE, and programs that do not require the GRE. Then run your profile through PA Program Match or PA Program Match AI.
Frequently asked questions
Is the PA school acceptance rate really 20%?
Not as a universal statistic. Different pages use different years and denominators. PAEA’s public 2024–2025 summary supports a national applicant-to-matriculant ratio of about 36.5% for that CASPA cycle. It is not a program acceptance rate or an individual prediction.
Are newer PA programs easier to enter?
Do not assume so. Newer programs may have a smaller applicant pool, but they may also have fewer seats, evolving admissions processes, or provisional accreditation considerations. Review the exact program and its ARC-PA history.
Should I apply to more PA schools to raise my odds?
A broader list can help only when every application is eligible and well matched. Ten carefully chosen schools are usually more defensible than twenty programs selected because a generic acceptance-rate list called them easy.
Acceptance data is useful when the definitions and year are clear. Keep it alongside your eligibility check and a thoughtful school list.
How this guide is maintained: National context is attributed to PAEA’s dated 2024–2025 public summary. The class-size list reads the published PA School Finder directory on page load; it is not a program acceptance-rate table. National statistics require a separate source review when PAEA publishes new figures.
Stephen Pasquini, PA-C
About PA School Finder and our editorial approach